CAPM is a method of portfolio selection analysis which focuses on maximizing return given some fixed variance.
It deals with optimal Capital Market Line, given here:
\begin{equation} E[R_{p}] = r_{f}+\frac{\sigma_{p}}{\sigma_{T}}\qty(E[R_{T}]-r_{f}) \end{equation}
Which describes \(E[R_{p}]\), the expected return of an optimal portfolio in a market, given, \(R_{T}\) is the market return, \(r_{f}\) is the risk-free rate, \(\sigma_{p}\) is the portfolio returns, and \(\sigma_{t}\) is standard-deviation of the market returns.
Sharpe Ratio
The Sharpe Ratio is a measure of the risk-adjusted performance of an asset—given the rate of return of some risk-free asset.
It is defined as:
\begin{equation} S_{a} = \frac{E[R_{a}-R_{b}]}{\sigma_{a}} \end{equation}
where, \(R_{a}\) is the raw return of the asset, \(R_{b}\) is the risk-free rate of return, and \(\sigma_{a}\) is the standard deviation of the asset “excess” return (i.e. standard deviation actual return - expected return—how much extra there is).
Minimum-Variance Boundary
For a given a weighted-average portfolio of stocks their waited averages, and correlations between the stocks you can draw this curvy curve. Let pink dots represent the two securities in your portfolio, and various curves highlighting possible linear combinations thereof—
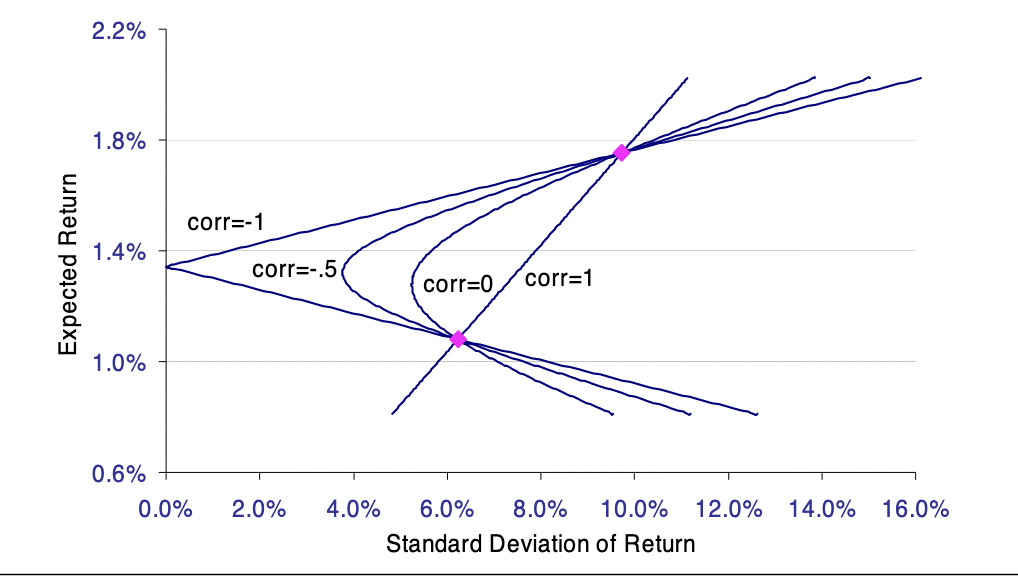
Let’s observe the boundary conditions of this curve.
If the two stocks are exactly negatively correlated, then the more risk you take the more return you have for one while less return you have for the other (hence, two straight divergent lines.)
If you have an exactly correlated portfolio, the two assets will will form a line.
The Effecient Frontier is the top half of this curve (i.e. higher risk/higher return is not a fun place to be, so that’s an inefficient frontier.)
Capital Market Line
The Capital Market Line is a line that uses the Sharpe Ratio of a market as a whole (how the market is performing against the risk-free rate) to analyze the performance of portfolio. It plots the performance of an “optimal portfolio” in a given market.
Let’s construct first the Sharpe Ratio of a hypothetical market:
\begin{equation} \frac{R_{t}-r_{f}}{\sigma_{t}} \end{equation}
where \(R_{T}\) is the market return, \(r_{f}\) is the risk-free rate, and \(\sigma_{t}\) is standard-deviation of the market returns.
We will multiply this value by the standard-deviation of your portfolio to calculate what the market claims should be your expected return. Then, we shift the line by the risk-free rate (as you are expected also to get that rate back in your return.
So an “effecient” portfolio (getting the max expected return per unit risk as measured by the market Sharpe Ratio) should behave like:
\begin{equation} E[R_{p}] = r_{f}+\frac{E[R_{T}]-r_{f}}{\sigma_{T}}\sigma_{p} \end{equation}
again, \(R_{T}\) is the market return, \(r_{f}\) is the risk-free rate, and \(\sigma_{t}\) is standard-deviation of the market returns.
The one liner is: “the return of your portfolio should be the base return by risk-free rate, plus how much excess risk you are taking on (and therefore return you should be getting back by the Sharpe Ratio)”
(how much you are expected to get (i.e. market Sharpe Ratio times your portfolio volatility), shifted back up by the risk-free rate.
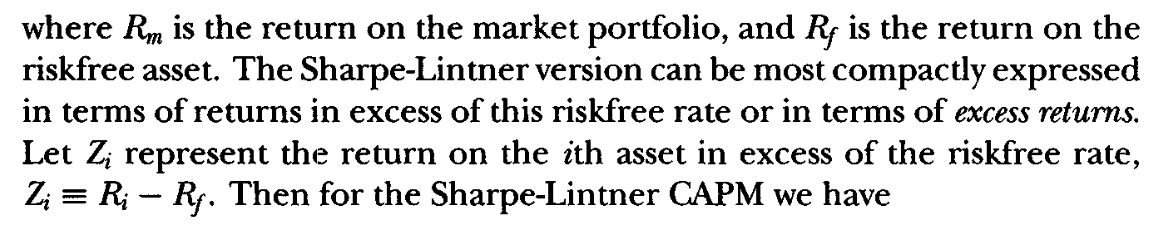
Sharpe-Lintner CAPM
A linear formulation of CAPM base on market-excess return (i.e. if you want to beat the market, you will have to sustain proportionally the same amount of risk.)
Tangency Portfolio
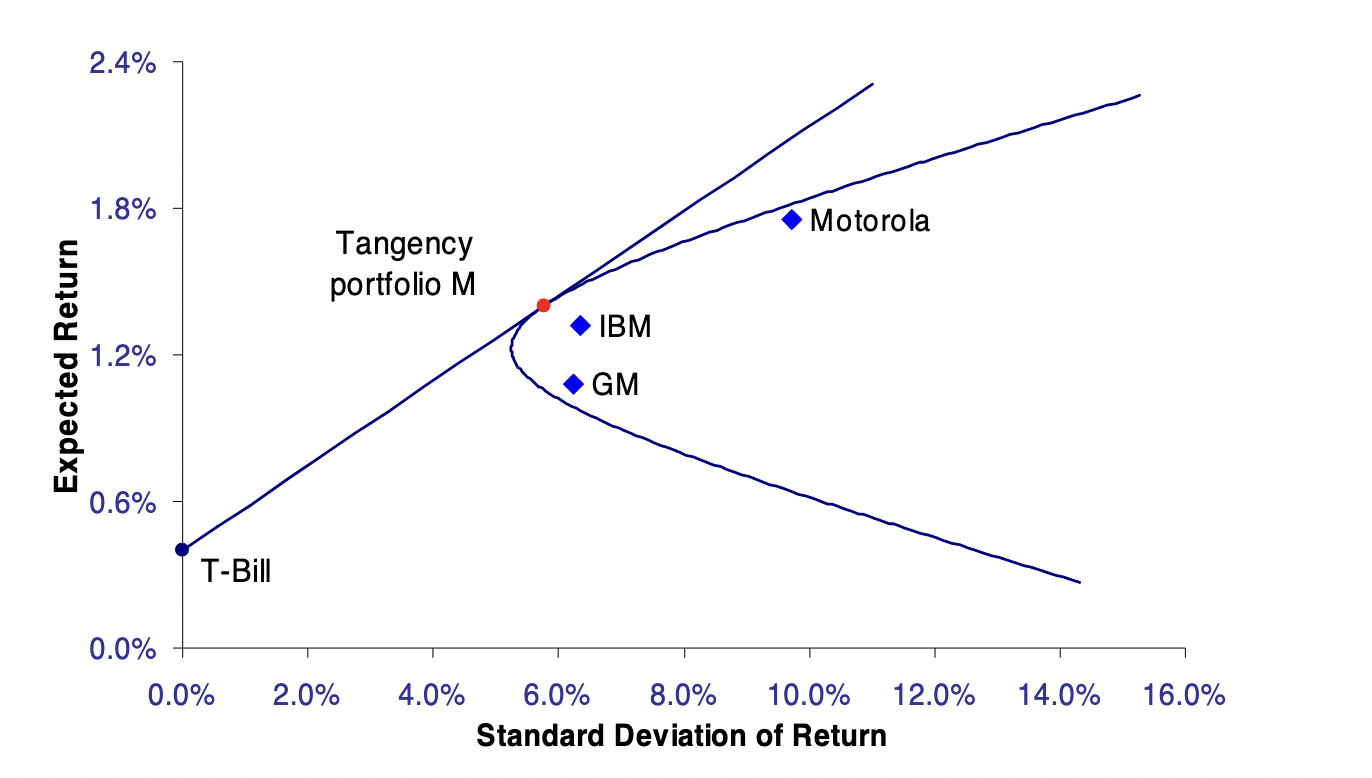
There is a portfolio, which is named the Tangency Portfolio. This portfolio is the tangent point between the Capital Market Line and the Effecient Frontier.
It represents the point where you can get the highest return given some risk, but also control the risk at the market’s Sharpe Ratio.
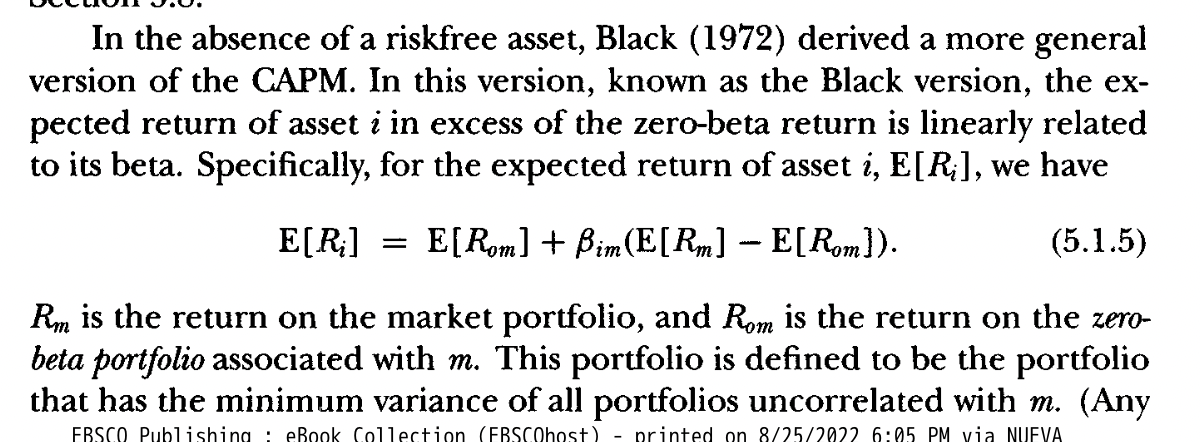
Black’s CAPM
CAPM depends on a risk-free asset. Black of Black-Scholes Formula fame derived another formulation of CAPM which doesn’t dependent on a risk-free asset.
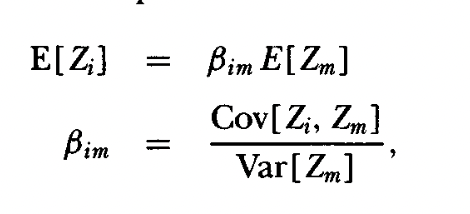
Zero-Beta Portfolio
To work with Black’s CAPM, we first define \(0m\), the Zero-Beta Portfolio (used in the formula as \(R_{0m}\), the return of the Zero-Beta Portfolio).
It is defined to be the portfolio with the minimum variance of all portfolios not correlated with \(m\).