Applying the MFA aligner upon the Pitt (cookie only) data and performing statistics upon the calculated disfluency information. The ultimate goal is to replicate Wang 2019.
The code is available here.
The (unvalidated, draft) results are reported below:
Mean value reported, standard deviation in parens. For our data, \(N=422\), cases balanced.
| Variable | AD (Pitt, ours) | MCI (Wang) | Control (ours) | Control (Wang) |
|---|---|---|---|---|
| Silence Duration | 28.10 (21.28) | 13.55 (5.53) | 18.06 (12.52) | 7.71 (5.03) |
| Speech Duration* | 23.77 (14.11) | 46.64 (5.79) | 27.23 (15.3) | 53.63 (7.82) |
| Voice-Silence Ratio | 1.79 (4.88) | 4.43 (2.78) | 5.78 (31.95) | 10.11 (6.05) |
| Verbal Rate | 1.59 (0.61) | 1.56 (0.40) | 1.989 (0.51) | 1.91 (0.43) |
*speech duration would obviously vary with file length
Further statistical quantification also tells us some more things. Although the data does not make a good classifier, I performed two tests: a Kolmogorov-Smirnov test for goodness of fit, and a good ‘ol Pearson’s correlation with AD/control target. p-values are reported below.
KS test
- silence duration: \(1.31 \times 10^{-5}\)
- speech duration: \(2.98 \times 10^{-3}\)
- voice-silence ratio: \(2.01 \times 10^{-7}\)
- verbal rate: \(4.32 \times 10^{-10}\)
Pearson’s
- silence duration: \(4.15 \times 10^{-8}\)
- speech duration: \(0.164\)
- voice-silence ratio: \(0.732\)
- verbal rate: \(1.22 \times 10^{-12}\)
As per the values reported in Wang 2019, we can see that—apart from audio metadata—verbal rate is a strongly correlated indicator against MCI/AD. We can reasonably say that Wang 2019’s data collection can be automated with reasonable success using batchalign + MFA.
Broken ML
I applied an RBF Support-Vector machine to classify AD/control based only on the two most highly correlated variables: verbal rate and silence duration. The results were disappointing.
On test data, N=42, balanced labels:
- SVC: \(61.9\%\)
- Random forest: also \(61.9\%\)
We have fairly disappointing results. Here’s my hypothesis of why:
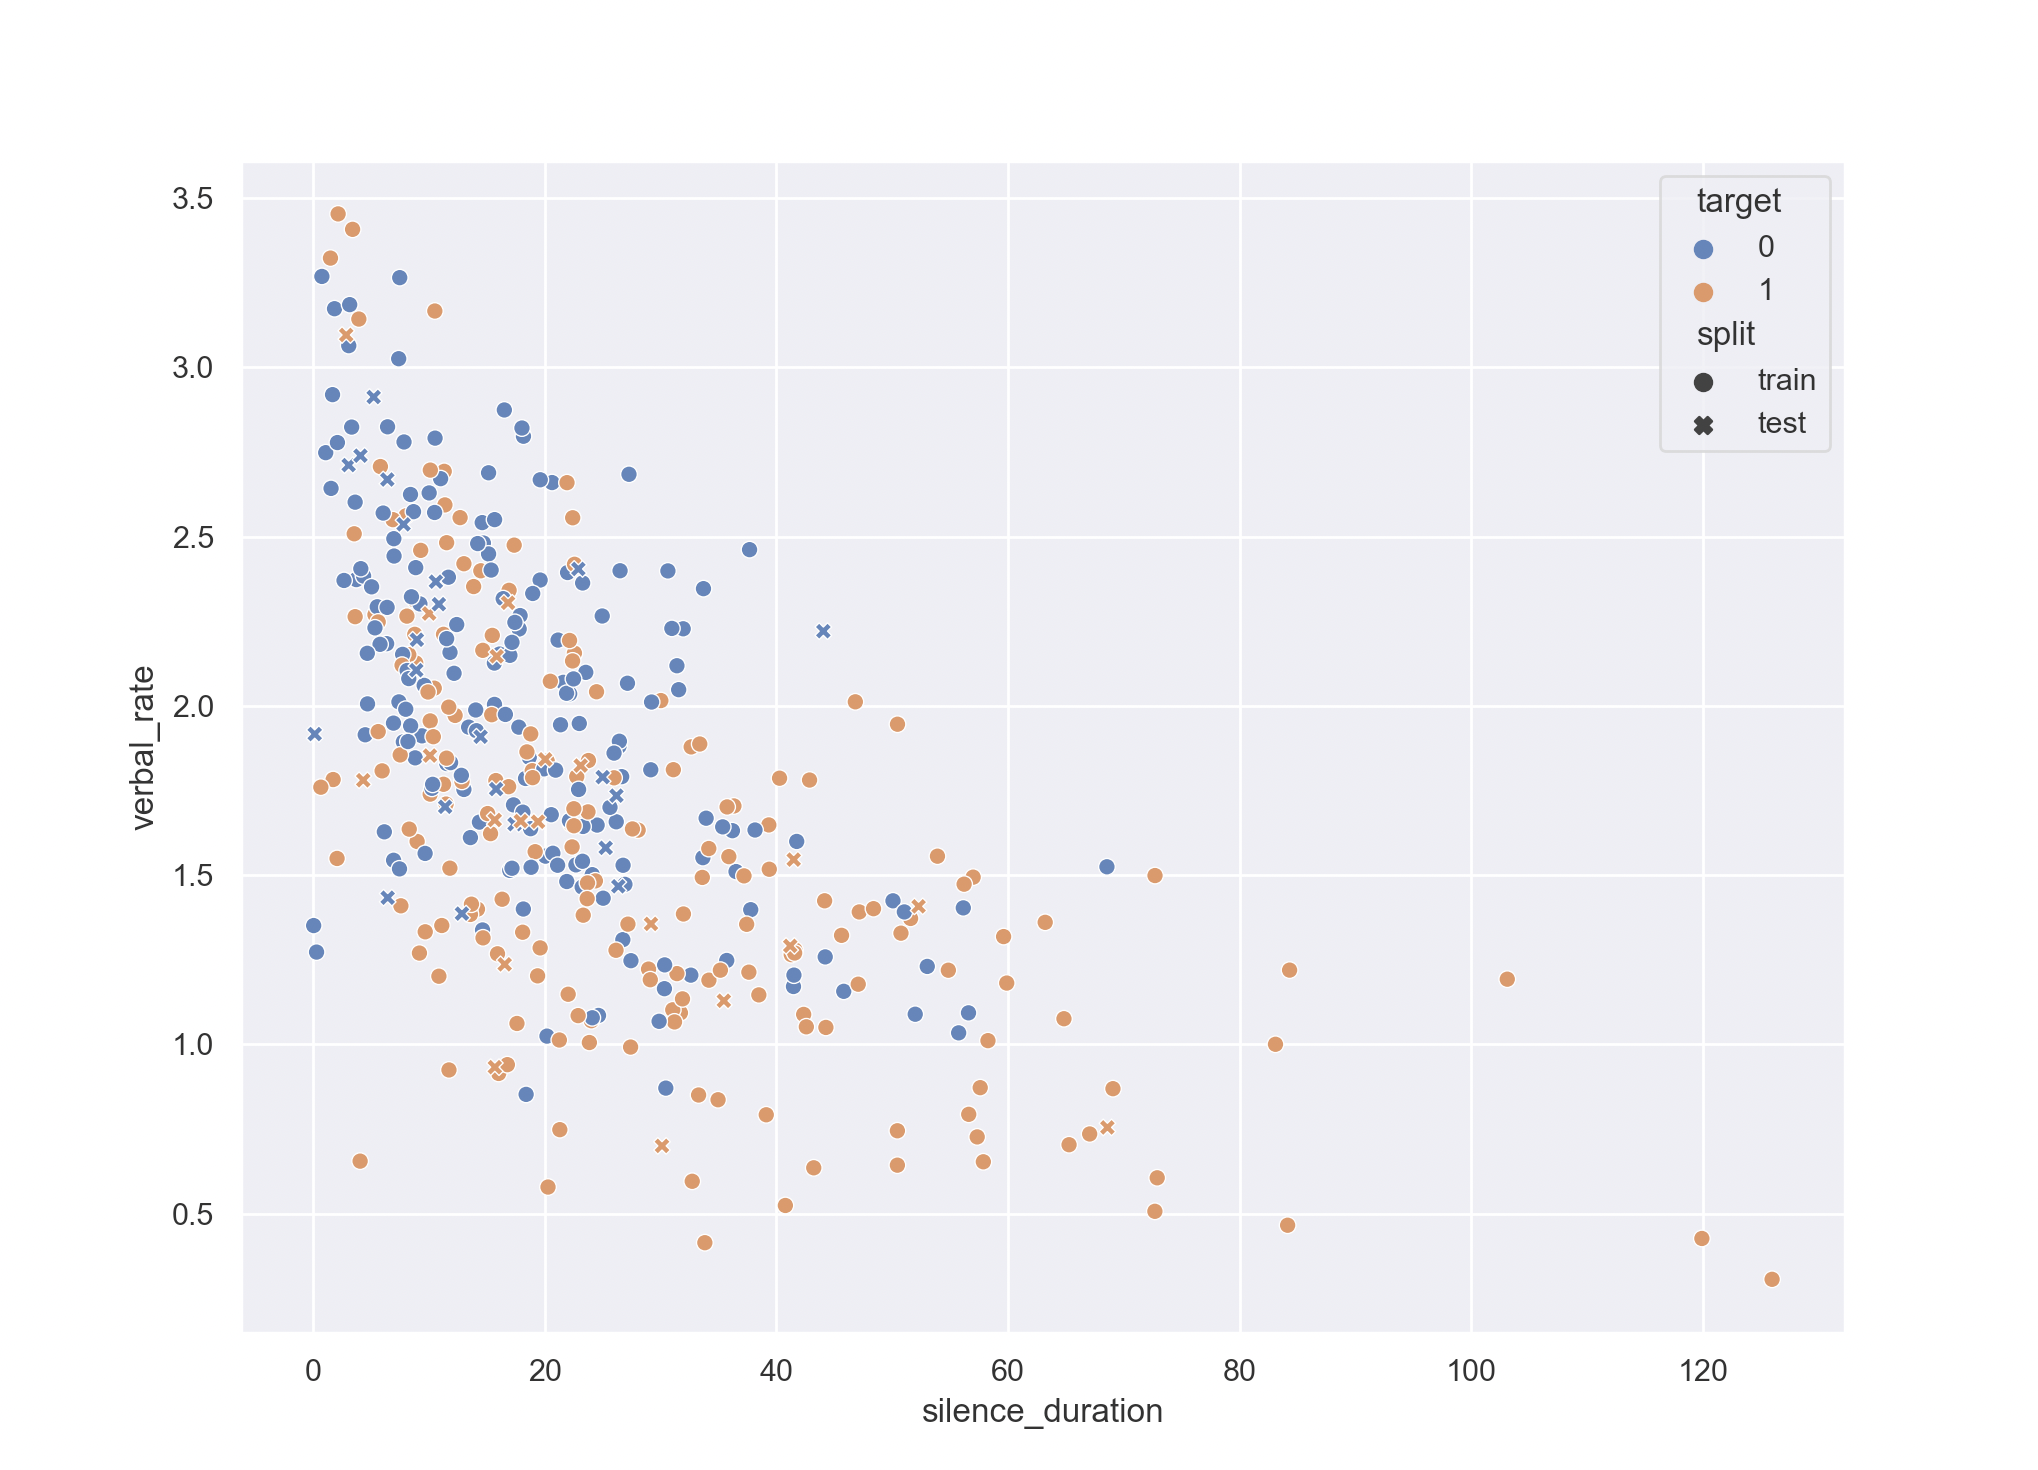
if you take a look at this figure, we can see two main distributions
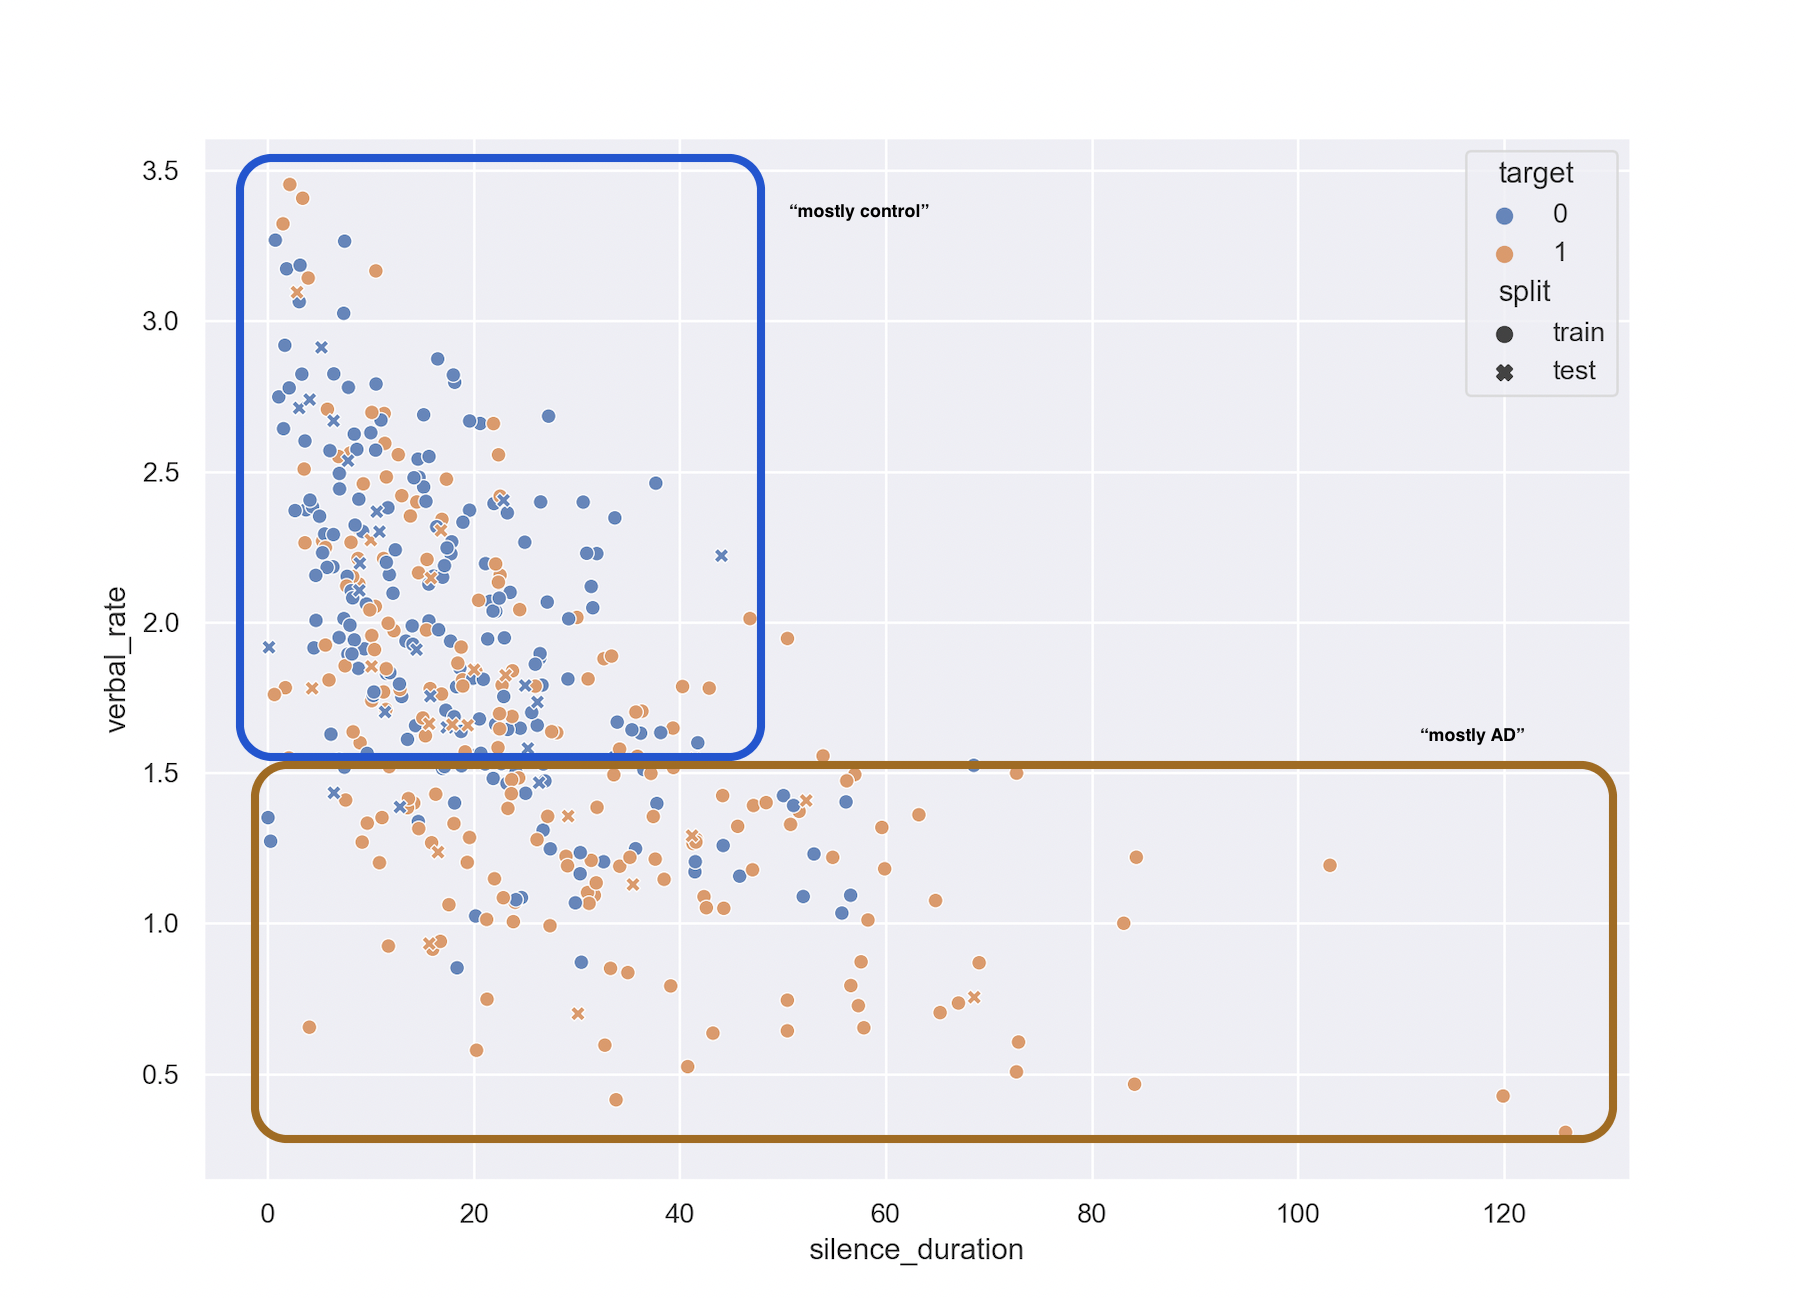
So, if we, like Wang 2019, used statistics on independence (they used chi-square, I used KS test), we will come up that the distributions are different.
However, if you take a look at a randomly sampled set of validation data (crosses on the figure), you can see that a lot of them lands in the “mostly control” area: making the classifier not super useful.
We can therefore catch a lot of the “slow talking, long pausing” patients, but most speaking fluently will possibly need semantic information for prediction.
I have some preliminary results on Pitt+ERNIE (a kind of BERT) that indicate that a key semantic factor is “on-topicness.” However, Pitt does not contain a lot of off-topic control data (say, the fluency task, which it has for dementia) for me to validate those claims easily. I will continue work on that front.